
Developed by Dangerous Deceibels
Students use a sound level meter to measure, compare and graph sound levels in different environments.
Science Topics
Sound Waves
Vibrations
Sound
Sense of Hearing
Health
Energy
Process Skills
Observing
Controlling Variables
Inferring
Questioning
Hypothesizing
Collecting & Graphing
Analyzing Data
Scientific Inquiry
Grade Level
5-9
Preparation
30 minutes
Set-Up
15 minutes
Activity
30 minutes
Clean-Up
5 minutes
Materials not in Kit
The NIOSH Sound Level Meter iOS app or Google Chrome Sound Meter web browser extension
Blender or radio (A blender is recommended)
Meter stick or tape measure
Introduce the Activity
First, introduce the decibel chart.
Zero decibels represents the softest sound we can hear, the threshold of hearing. An increase of 6 decibels represents a doubling of the air pressure change created by the sound wave. A 30 decibel increase creates 32 times as much sound pressure as did the original sound. In other words, a 40 decibel sound creates sound pressure levels that are more than 30 times as great as a 10 decibel sound. The threshold of pain for the average human ear is 120 decibels. This represents a pressure change over 991,000 times greater than that experienced by the ear when exposed to a 0 decibel sound!
Ask students to make hypotheses about what happens to a sound as you get further and further away from the source or closer to the source. Does the sound get louder or softer? How fast does the sound change?
Doing the Activity
- Place blender or radio near the edge of a flat surface facing the classroom. If using a radio, turn on the radio and de-tune near a known radio station until there is a constant static sound. If using a blender, turn it onto the loudest setting
- Have a student hold the sound level meter (phone or computer microphone) about 4 inches away from the radio or blender.
- Adjust the speed of the blender or volume of the radio to get as close to a steady 80 dB reading as possible. This will be the initial sound level and the zero distance for comparing sound levels change with distance.
- Without changing the speed of blender or volume on the radio, have the student move away about 4 or 5 steps from the sound source holding the sound level meter and record the sound level in dB. You may need to reduce the decibel range of the sound level meter as it is moved further away from the source of the sound.
- Have the student move back another 10 steps holding the sound level meter and record sound levels in dB.
- Collected data can be graphed with distance as the independent variable (x-axis) and sound level as the dependent variable (y-axis).
Procedure may be repeated with the weighting adjustment selected for C-weighting.
Note: the results will vary depending on the acoustic characteristics of the room.
Discussion
Ask students the questions in bold. Possible responses are in italics.
Ask students if the sound level changed with distance as they had predicted. Was the change faster or slower than they thought it might be?
Answers will vary with predictions.
Ask students to give examples of some loud sounds they are exposed to in their environment.
Noise is not the only cause of hearing loss, but it is the most common cause in America (and in other industrialized nations). Loud sounds (above 85 dB for 8 or more hours) can hurt your ears by damaging the sensitive hair cells of the inner ear. It makes no difference whether you like the loud sounds or not – if they are over 85 dB, they can begin to damage hair cells in your inner ear.
Because there is currently no treatment to repair hair cells that have been damaged by loud sound, it is important for people to protect themselves from such damage. Fortunately, there are several actions a person can take to prevent noise-induced hearing loss.
Following are three major ways to obtain hearing protection:
- Turn down the volume
- Walk away (put as much distance as possible between your ears and the sound source)
- Wear hearing protection
Questions to determine whether you are being exposed to excessive sound that may damage your hearing.
Are you often in an environment where the sound is so loud that you have to shout to make yourself understood?
After exposure to loud sound, have you ever noticed tinnitus (ringing or other noises in your ears or head)?
Does music sound slightly strange or distorted after you have been listening for a while?
Do voices sound muffled after you’ve been around loud music or other loud sounds for an extended time?
After exposure to loud sounds do your ears sometimes feel “full” or “stopped up”?
When you are listening to stereo headphones or a personal music player, can a person standing next to you hear it too? (When you are using a personal music player, you should be able to understand a person next to you speaking in a normal tone of voice.)
If you answered YES to any of these questions, you may have been exposed to damaging sound levels
Explanation
The ability of a normal, healthy human ear to hear spans an enormous range. Because of this, the scale for measuring sound must also span an enormous range yet still be easy and compact to write. This is why the decibel scale is related logarithmically to the huge range of pressure amplitudes that the ear is subjected to. This helps us to compress the huge range of hearing so that our response to variations in loud sounds is similar to the response to variations in weak sounds. The pressure change experienced by the ear when subjected to a 120 decibel sound (Caution! This is the pain threshold for the average human ear!) is about one million times greater than the pressure change created by the softest sound we can hear, defined as 0 decibels. It is easier and takes less room to write 0 dB or 120 dB than a number followed by six zeroes!
To understand the relation between pressure amplitude and decibels it helps to understand that as a sound wave moves through the air, slight increases and decreases of the background air pressure occur. The size of these increases and decreases are called pressure amplitude. The size of these increases and decreases is also related to the loudness of the sound.
Decibel scales can be used for many measurements other than sound where there are large ranges of values. There are decibel scales defined for use in electronics and optics. The scales vary depending on what quantity is being used as a reference. One of the decibel scales for sound provides a way of creating a logarithmic scale relative to a pressure amplitude reference. This reference value is referred to as the threshold of hearing (for obvious reasons).
The pressure amplitude for the threshold of hearing is:
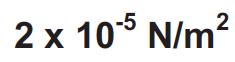

This is a standard value defined for a pure sine wave at a frequency of 1000 Hz. The decibel scale for pressure amplitude is called Sound Pressure Level, typically abbreviated SPL. The formula relating SPL to pressure amplitudes is:
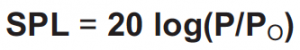

SPL is the sound pressure level in decibels
Po is the reference threshold of hearing, 2 x (10 raised to -5) N/m²
P is the measured pressure amplitude in N/m²
Using this formula, it can be shown that an increase of 6 decibels results in a doubling of the pressure amplitude (and a decrease of 6 dB cuts the pressure amplitude in half). Or that increasing the SPL from 70 dB to 80 dB increases the pressure amplitude experienced by the ear by 3.16 times and increasing from 70 dB to 90 dB increases pressure amplitude by (3.16)2 or about 10 times.
Optional Extensions
Allow students to use sound level meter to monitor sound levels during activities around the school such as lunch room, pep rally, classroom, test time, playground, etc.
Allow students to check out sound level meters and monitor at-home activities such as street, interior auto, and music listening sound levels.