Physics of Stringed Instruments

Gordon Ramsey – gpr@anl.gov
Katarzyna Pomian – kpomian@luc.edu
Loyola University Chicago
1032 W Sheridan Rd, Chicago, IL 60660

Popular version of paper 1pMU4 and 1pMU5 presented at the 2014 167th ASA Meeting in Providence Rhode Island.


Our objectives for this project include an in depth analysis of the properties of stringed instruments. We strived to understand how different stringed instruments function individually, and how instruments differ in their sound and function. Stringed instruments create the sound in three phases: (i) the source or string, (ii) the medium or body and (iii) the interface, which is the oscillation of the air around the body. These elements interact to create the sound we hear in each instrument. In this research, we gathered string oscillation data, vibrating the strings at different locations with different methods of excitement. We studied body vibrations by looking at the sand patterns that form when the instrument is excited at different frequencies. We also analyzed high-speed videos of the strings to better observe the oscillations produced. We performed comparisons of the instruments that revealed each instrument’s unique characteristics.

Musical instruments create sounds at their natural vibrational frequencies, which depend upon their size and structure. The natural frequencies of a musical instrument are called the harmonics of the instrument. The parts of an instrument interact and force each other into vibrating at their harmonics (standing wave patterns). This is known as resonance. A string fixed at both ends can oscillate in many modes, called harmonics. These must keep the string fixed at the ends. These harmonics are shown in Figure 1.

The top shows one-half complete wave between the ends. The second shows one complete wave (two halves) between the ends, etc. One full wave has an effective length, called a wavelength. The note that is heard disturbs the air at a rate called the frequency. The wavelength and frequency are inversely proportional. The shorter effective wavelength corresponds to a higher frequency. The string player changes the note by changing the effective length of the string. The waveforms in Figure 1 represent multiple frequencies, called harmonics. Instruments emit multiple harmonics with different strengths, which give each instrument its unique sound. Although one actually hears the note that corresponds to the fundamental (first) harmonic, the brain interprets all the harmonics as a recognizable instrument.
Figure 1. Harmonic waveforms
The sound of each instrument is unique because it exhibits characteristic frequencies that set it apart from other instruments. We gathered sound data using a computer interface that captured the sound through a microphone and turned it into a raw waveform. The experimental setup is shown in the next three figures:
Figure 2. Experimental setup
Figure 3. Measurements of the mandolin
The procedure was repeated for the twelve instruments we studied. We analyzed the waveform harmonic structure (see Figure 5 for an example), revealing the characteristic frequencies and corresponding intensities of the particular instrument.
Figure 4. Strummer measurements
[In Figure 5,] the insert on the left shows the equally spaced harmonic structure of the violin for that note. We excited the instruments’ strings by three methods: the point source (pick), the thick source (bow) and the extended source (thumb/pluck). These were placed at different locations: the octave (half string length), the normal position and the bridge (about one third and one fourth the length from the bridge, respectively).
Along with string resonances, the bodies of stringed instruments also vibrate. Our examples exhibited different body shapes. We studied these body oscillations by distributing sand on the body of an acoustic guitar (figure eight), dulcimer (peanut), mandolin (teardrop), and strummer (triangular). These instruments have a flat body, so when excited, the sand distributes itself in the places that are not vibrating. An oscillator was placed against the body to induce vibrations in the instrument. As the frequency increased we observed how the sand patterns formed and related them with the string data. The dulcimer resonances are shown below.
Figure 6. Mountain dulcimer
Figure 7. Dulcimer body resonances
The resonances seen above occur at frequencies of 0 Hz (no excitement), 80 Hz, 110 Hz, 236 Hz, 362 Hz and 408 Hz, respectively. The bare locations are where the body oscillations occur and contribute to the overall sound of the instrument.

The harmonic structure of stringed instruments is reflected in the string resonances, since they initiate the sound. High-speed videos of the string were taken to portray the real time oscillations. We created mathematical models of the strings from the harmonics, and compared the visual representations in the high-speed videos to them. A high-speed camera and a bright light source were used.

When the waveform is reconstructed from the harmonics, it looks like [Figure 9] below. This compares favorably with the actual waveform. The video shows the intermediate oscillations as a hesitation between the extremes.

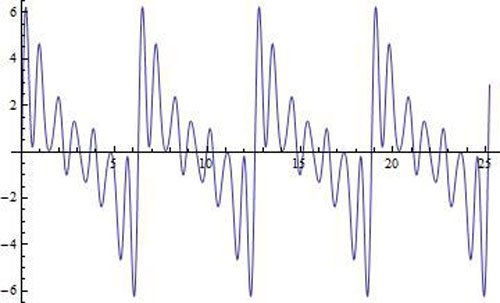
Figure 8. High-speed video of viola normal bow string resonance
Figure 9. Viola normal bow-string resonance mathematical reproduction
The following pie charts of the viola show the relative contribution of the harmonics, using a bow (top) and a pluck (bottom). Note that the bow creates a larger number of harmonics, giving a richer sound. The small amount of harmonics in the pluck result in a purer sound.
Figure 10. Viola normal bow string resonance pie chart
Figure 11. Viola normal pluck string resonance pie chart
To understand the differences amongst instruments, we correlated the string and body oscillations. The instruments were separated into their corresponding body shapes to see the differences. The results for the lesser-known instruments follow here.

The figure eight and triangular shaped instruments produced a significantly larger amount of harmonics with the pick as compared to the peanut or teardrop shaped instruments. The circular shaped banjo body excited the highest amount of harmonics, yielding its “tinny” sound.

The body oscillations mainly affected the fundamental and second harmonics. For the mandolin and the acoustic guitar, the body oscillations only affected the fundamental harmonics. The strummer data indicated that the notes excited with the thumb had a much larger correspondence with the body oscillations.

The following figures show the relations between the string and body resonances for the dulcimer, strummer and banjo that work together to form the unique sound of the instrument. The dulcimer and strummer have a wooden body, while the banjo’s body is a membrane. The colored numbers indicate different body resonance frequencies and the percents represent the fraction of the sound that is due to the body resonance. The dulcimer has a peanut shape and is comparatively much larger than the strummer, which is triangular. The strummer excited fewer harmonics than the dulcimer did.

Figure 12. Dulcimer string resonances and body shape
Figure 13. Strummer string resonances and body shape
Figure 14. Banjo string resonances and body shape
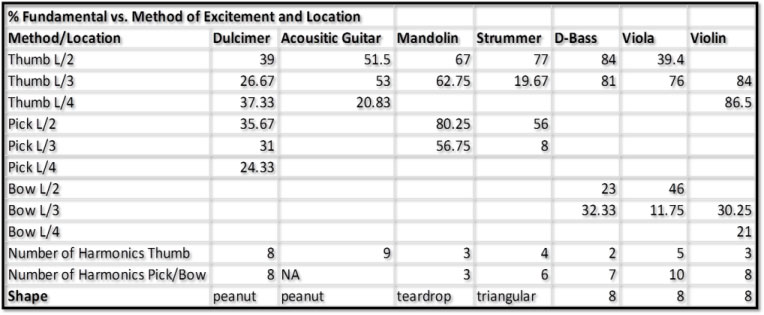
The correlations between seven of the instruments discussed above (the strings are similar, but bodies make a difference) are shown in the following chart. The numbers show the percentage of the total intensity represented by the fundamental (note heard). Larger numbers correspond to purer sounds and smaller with richer sounds.

Figure 15. Correlations of string resonances with body shape – seven of twelve instruments

Studies like this allow us to understand instruments better, so that artists can make best use of their characteristics and instrument designers can build more innovative instruments.

References:

D. Hall, Musical Acoustics, 3rd Ed.

Rossing, The Science of Sound, 3rd Ed.

http://www.physicsclassroom.com/Class/sound/U11l5a.cfm