Listening to Antarctic Ice Breaking from Australia
Alexander Gavrilov – A.Gavrilov@curtin.edu.au
Binghui Li
Centre for Marine Science and Technology
Curtin University of Technology
Popular version of paper 1pAOa3 presented at the 155th ASA Meeting in Paris, France.
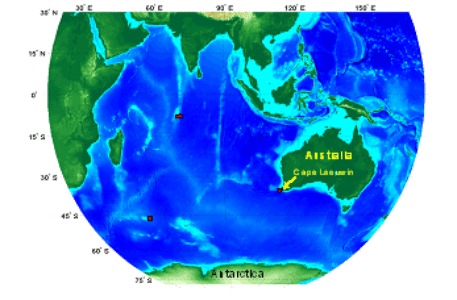
Figure 1: Location of three CTBT underwater listening stations in the Indian Ocean
An analysis of 7-year long recordings of sea noise made at the CTBT underwater station off Cape Leeuwin in Western Australia has shown that Antarctica is the major source of low-frequency noise in the Southern Ocean and southern parts of the Indian Ocean (Figure 2). Two different kinds of signals arriving at the Cape Leeuwin station from Eastern Antarctica can generally be distinguished. The most amazing of them are iceberg songs, which are very-low-frequency, from about 3 Hz to 10 Hz multi-harmonic signals lasting sometimes for several hours and which are supposed to be produced by vibrations of the iceberg plate after collision with the seafloor, ice shelf or another iceberg (listen to an iceberg song played back 20 times faster to bring it into the frequency range of human hearing).
The second type of Antarctic noise signal comprises short-term sound pulses, which are the main focus of this study, because they are believed to be emitted by ice cracking and breaking events. More than a hundred of such signals are detected weekly at the Cape Leeuwin station. To examine the origin of these signals, an autonomous sea noise recorder was installed on the seafloor of the Antarctic continental shelf for a year, to make recordings concurrently with the CTBT station off Australia. The sound signals from a series of ice cracking and breaking events recorded on the Antarctic noise logger are shown in Figure 3 (and also played back 20 times faster than the real signal).
This series of signals recorded at Cape Leeuwin looks similar in general, but the waveform of each individual signal has dramatically changed after traveling over 3500 km. Only low-frequency components from about 5 Hz to 30 Hz reach Australia. Moreover, because of peculiar environmental conditions in the polar seas, where the speed of sound is minimum at the sea surface and grows steadily with depth, the lower frequency components travel faster than the higher frequency ones, which makes the recorded signals sound like an up-tone whistle when played back 20 times faster.
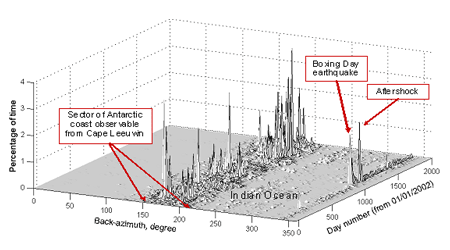
Figure 2: Percentage of time when low-frequency noise signals were observed in different directions from the Cape Leeuwin station in 2002 – 2007. It is obvious that the majority of sound signals arrive from Antarctica. Note also that the Sumatra fracture zone visible from Cape Leeuwin at about 340 ° has been permanently making noise since the Boxing Day earthquake.
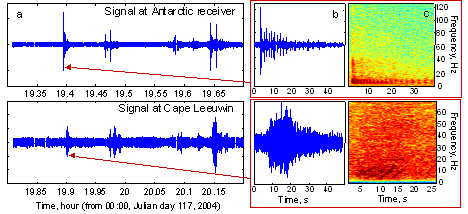
Figure 3: (a) Signals from the same series of transient events recorded on the Antarctic sea noise logger (top) and at the Cape Leeuwin station (bottom). Waveforms (b) and spectrograms (c) of the first signal in the series of events at the logger (top) and Cape Leeuwin (bottom).
Another important finding is that certain parts of the Eastern Antarctica ice shelf observed from Cape Leeuwin are much noisier than other parts, which is demonstrated in Figure 5 showing the total number of ice events detected at the CTBT station in all directions to the Eastern Antarctica coast. Some of the noisiest shelf areas are undoubtedly associated with the glaciers, which are known to be active sources of newly calved icebergs, such as the Dibble and Dalton Ice Tongues. On the other hand, the largest number of ice signals arrive from the continental shelf north of Law Dome, which is a very thick coastal glacier, located east of the Australian polar station Casey, and which does not stretch into the sea with an ice tongue. More research is needed including in-situ observation to explain the noisiness of this part of the Antarctic shelf.
This research project is continuing, however, it is already possible to conclude that remote underwater acoustic observation is a useful and cost-effective approach to monitor ice cracking and breaking processes in Antarctica and is an efficient supplement to satellite remote sensing and in-situ observations aimed at climate change studies in Antarctica.
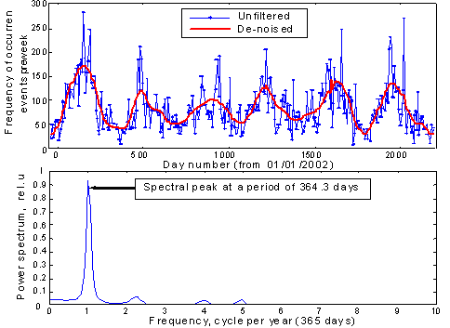
Figure 4: (top panel) Temporal variations of the number of signals from Antarctic ice events detected weekly at the Cape Leeuwin underwater listening station shown before (blue line) and after (red line) de-noising by low-pass filtration; (bottom panel) Power spectrum of unfiltered variations demonstrating the presence of a strong seasonal cycle.
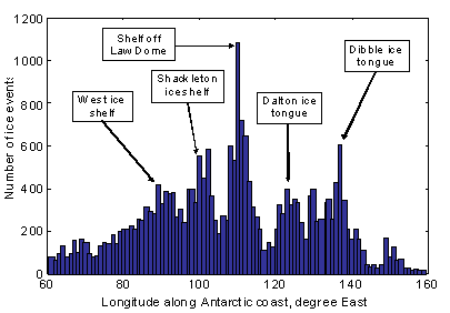
Figure 5: Histogram of the total number of ice events located from the Cape Leeuwin station in different directions to the Eastern Antarctica shelf in 2002-2007.
