Spectrogram Lab
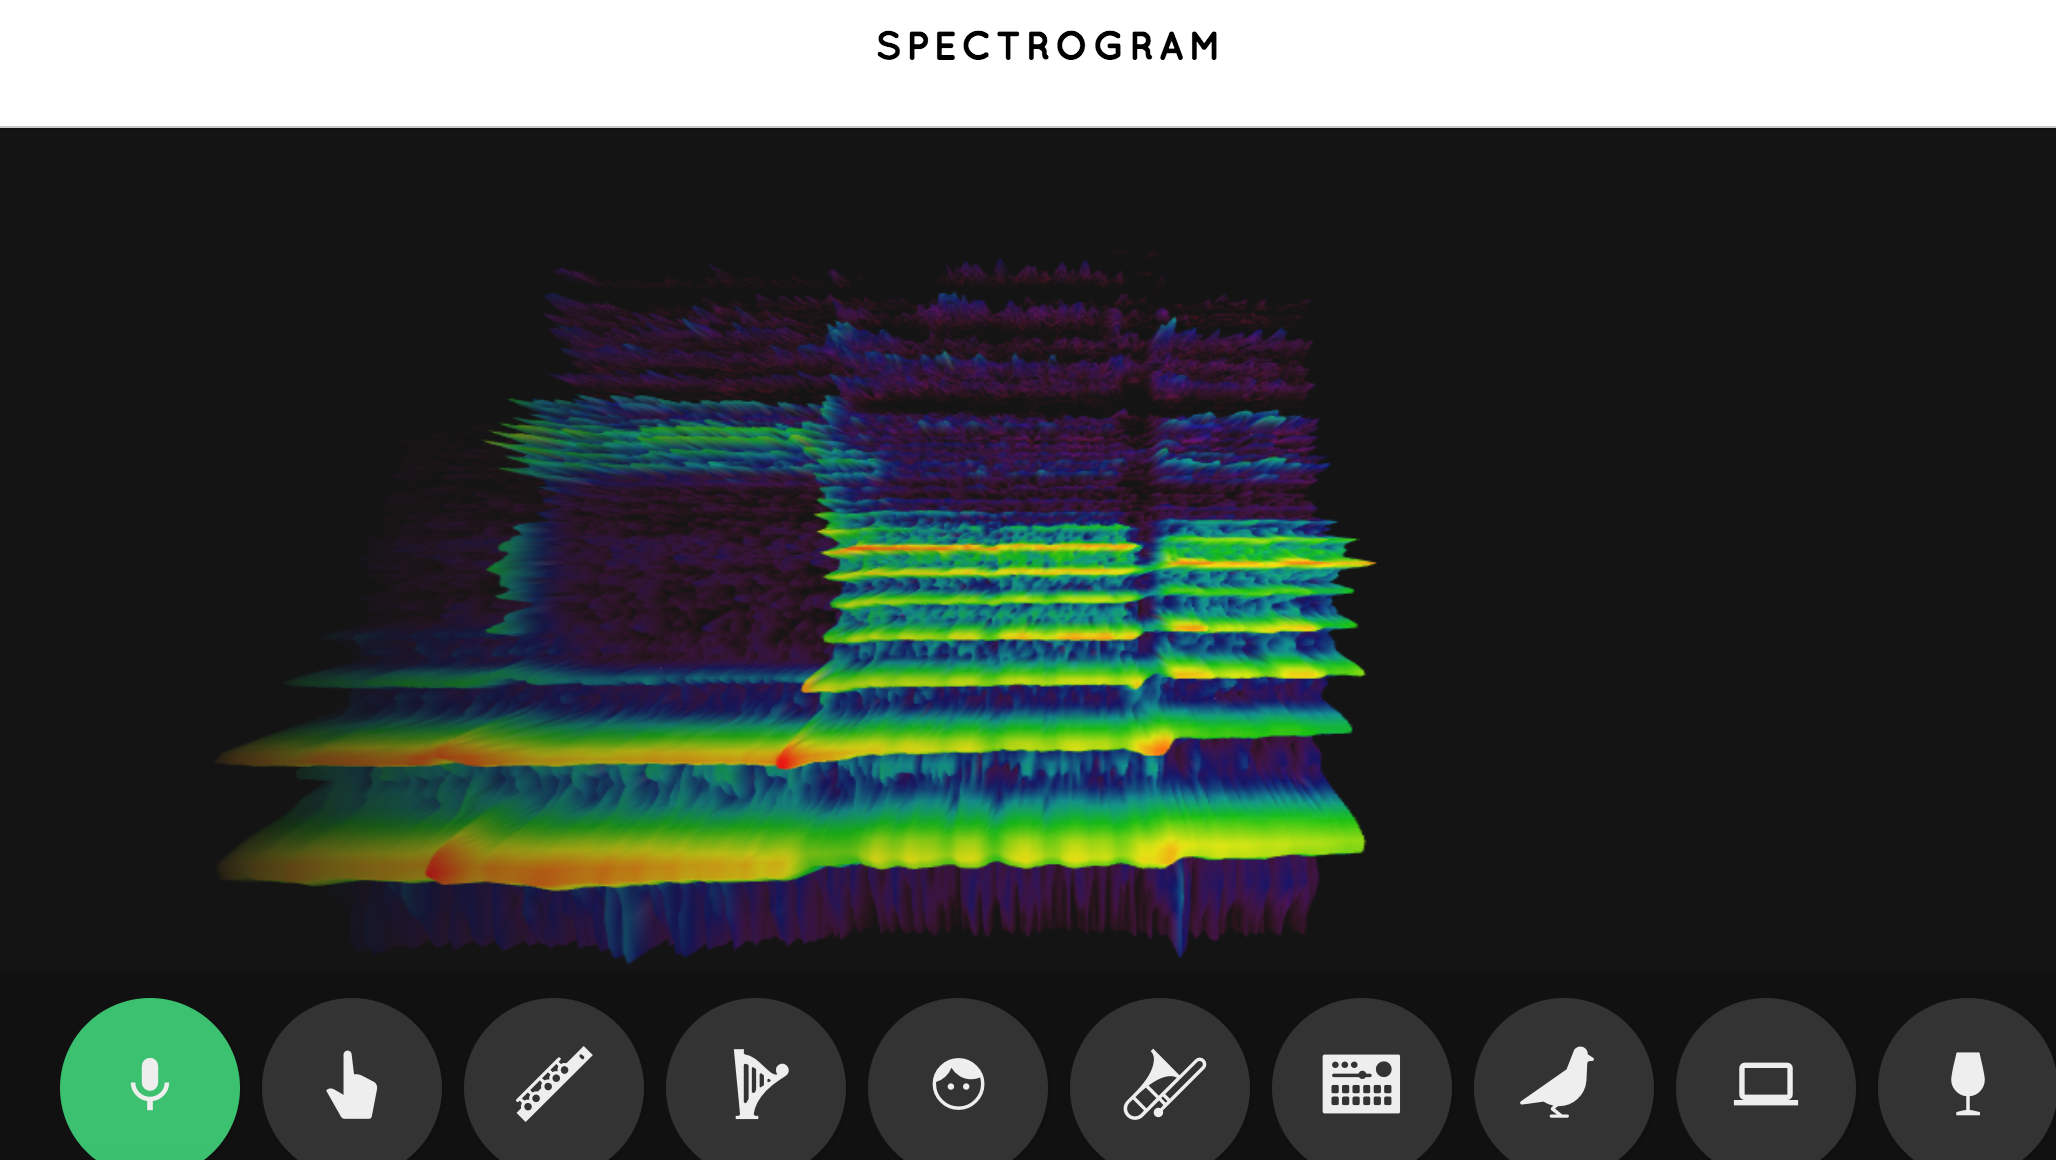
This spectrum analyzer creates a graph of all the frequencies that are present in a sound at a given time. The resulting graph is known as a spectrogram. The darker areas are those where the frequencies have very low intensities, and the brighter areas represent frequencies that have high intensities in the sound.
What you need
- Computer with internet access
- Internal or external microphone
- Chrome Music Lab Spectrogram
Here’s what you do
- Hold your fingers against the front of your throat, where the small bump is and say “Zzzzz?” Does your throat vibrate?
- Now try saying “Sssss” (not “Essss”). What is vibrating? How is the “Zzzzz” sound different from the “Sssss” sound?
- Click the microphone button.
- Start off saying “oooooh” and then change into saying “aaaaah.” What do you notice about the image?
- Change the sound from “aaaaah” to “eeeeee.” How would you describe the differences in these images?
- Now try saying “Sssss” (not Esssss). How does this image compare to the vowel sound images?
- Make the sound “Shhhh.” How are “Sssss” and “Shhhh” spectrograms different?
- Click on the flute button now. How does the spectrogram compare to speech?
Special Thanks
to Chrome Music Lab. Chrome Music Lab is a collection of experiments that let anyone, at any age, explore how music works. They’re collaborations between musicians and coders, all built with the freely available Web Audio API.